


Quick Links
What
is Sound?
-
Noise Pollution
What
Causes Noise from PCs?
-
What is A Decibel?
-
Sound Pressure
-
Sound Pressure Level
How
is Noise Perceived?
-
Frequency
-
Loudness
-
Sound Weighting Systems
Sound
Power Levels vs Sound Pressure Levels
Noise Measurement
For IT Equipment
-
Measurement of Sound Power Levels
-
Declaration of Sound Power Levels
-
Noise Measurement Standards
-
What to Look for
How Noise
From PCs Affects Our Health
References and
Helpful Links
![]() Perception and Measurement of Noise from PCs and IT Equipment 100Kb
Perception and Measurement of Noise from PCs and IT Equipment 100Kb
Perception and Measurement of Noise from PCs and IT Equipment
This article on PC Noise gives a great framework for understanding why we are so keen to eliminate unwanted noise from our work and home environments. We explore the nature of sound, how it is measured and what standards to look out for in the IT industry. We also look at some fascinating insights into how noise from PCs affects our health.
What is Sound?
Sound is an energy which is generated by a source, transmitted through a medium, and received by a receiver.
The sound waves that travel outward from a source are tiny fluctuations of pressure, both positive and negative, caused by the air being alternatively compacted and rarefied by the vibrating source.
Our ears detect pressure waves from the 'vibrating' source, translate them into electrical signals, and send them to the brain where they are decoded.
Sound can be either wanted or unwanted. When it is wanted, we call it sound but when it is unwanted, we call it noise.
Noise Pollution
Noise pollution in the world around us is a growing problem. In our everyday lives we have to tolerate high levels of noise such as traffic, busy shopping centres and background noise in our workplaces and homes. Sometimes it seems as if there is no escape. As more and more people use computers both for work and for leisure, we are finding we are being exposed to yet another source of noise.
Interestingly, the word 'noise' is derived from the Latin word for 'nausea', meaning 'seasickness' - noise can literally make us ill!
What Causes Noise from PCs?
The noise generated by a 'standard' PC typically varies from 30dB(A) to 50dB(A). This upper level is loud enough to be distracting and cause stress when working nearby for an extended amount of time.
This problem has escalated as PCs become more and more noisy due to:
- PC components have increased in speed and in the amount of heat they generate
- Fans to dissipate this heat are a major source of noise
- Hard disks have platters that spin at very high speeds causing noise and vibration
- Badly designed cases have side panels that rattle and vibrate
- Optical drives like DVD and CD-ROM can also generate noise, such as wind noise and vibration
What is a Decibel?
The decibel is the most widely used indicator of loudness, a logarithmic ratio of sound pressure level to a reference level. The range of human hearing of sound loudness in dB will range between 0dB (which is the threshold of hearing), up to an ear-splitting 135dB for the very loudest sounds (which literally may cause pain!).
In acoustics we find huge changes in measurable parameters (e.g. pressure, power) correspond to relatively small changes in perceived loudness. Simply using a linear scale is impractical since the large variation in numbers gives little guide to the variation in perceived sound. Instead it is more practical to convert to a logarithmic scale.
The bel scale (named after the inventor Alexander Graham Bell) is a means of expressing power or pressure as logs to the base 10. To create a more meaningful range of numbers to express power or pressure, the common convention is to multiply by 10 (hence decibels). Just about every piece of audio equipment (e.g. microphones, loudspeakers, sound cards and amplifiers) will have specifications expressed logarithmically (i.e. in dBs). Below we have a short explanation of logarithms. You may notice this section contains some maths, however you can still make sense of this article even without a maths degree! We will use this mathematics later.
For our logarithm example, think of the number one million...
1,000,000
We can express this as 10 x 10 x 10 x 10 x 10 x 10
or 1,000,000 = 106
More generally we can write y = x n
Using the logarithm function we would write this as n = logx y
Which in our 'one million' example would look like 6 = log10 (1,000,000)
So the logarithmic value of 1,000,000 is just 6.
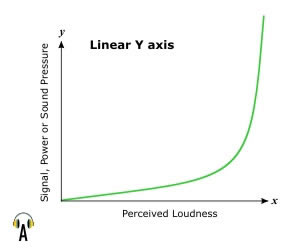
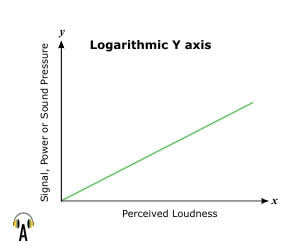
As you can see from the graphs below, as the perceived loudness increases, the numbers on the linear Y scale (on the left graph) quickly become too large for us to see. Using a logarithmic Y scale (on the right graph) it is easier to see the upper and lower values and therefore easier to use.
A log is just an index to a number and it is useful to note that a log can be manipulated according to some basic maths rules. For example, where two numbers multiply we can add their logs and where two numbers divide we can subtract their logs.
Another important rule is: -
log(1) = 0
We can use this rule to set a zero point of a log scale. So for instance, if we wanted a log to base 10 scale for y to have zero at yref we would use...
n = log10 ( y / yref )
This means useful parameters such as pressure and power can be given as a ratio with respect to some fixed reference (e.g. threshold of hearing) determining the zero point on the scale.
Sound Pressure
Let's further explore the measurement of pressure waves moving outward from a source by looking at air pressure, sound pressure and sound pressure levels.
Air pressure is the force exerted on a surface by the weight of the air above it. It can be measured in Pascals (Pa) where force F per unit area A can be expressed by P = F / A.
The presence of a sound causes fluctuations in air pressure. This sound pressure rapidly varies in peaks and troughs as its compression wave hits a surface. However, the rate of variation is so high that most instruments detect a wave of overall constant power imparted and hence, in effect, a constant pressure. To measure this pressure we use the Root Mean Square (RMS) which is a standard way of obtaining a meaningful value for the average of something that varies with time.
We can directly measure the RMS pressure levels of common sound sources:
Sound Source |
Pressure (Pa) |
Threshold of pain |
112.5 |
Riveter |
20 |
Speech |
0.02 |
Leaves Rustling |
0.0002 |
Threshold of hearing |
0.00002 |
As you can see there is a large variation between quiet and loud sounds. This linear measuring scale is awkward to use since small variations in loudness are represented by large variations in sound pressure. Hence the need for a logarithmic scale as we see below.
Sound Pressure Level (SPL)
Because of the large variations in sound pressure demonstrated above, pressure levels in Pascals (Pa) are taken with respect to a reference and converted to logs. The resulting Sound Pressure Levels are in decibels (dB).
SPL = 20 log10 ( P / Pref )
Where SPL is Sound Pressure Level in dBs relative to Pref, which is the threshold of hearing (0.00002 Pa or 2 x 10⁻⁵ Pa).
As you can see the dB scale gives a more useable representation of sound sources:
Sound Source |
SPL (dB) |
Threshold of pain |
135 |
Riveter |
120 |
Speech |
60 |
Leaves Rustling |
20 |
Threshold of hearing |
0 |
Although Decibels are a useful way of expressing large changes in sound pressure levels, they need careful use when adding or subtracting noises! Decibels, being a logarithmic ratio cannot be added or subtracted arithmetically. As an example, if we have 2 quiet cooling fans each rated at 21dB(A), they have a combined noise level of 24dB(A), and NOT 42dB(A). The method of addition of sound pressure levels (SPLs) in dB is indicated in the table below:
Difference in dB |
0 |
1 |
2 |
3 |
4 |
5 |
6 |
7 |
8 |
9 |
10 |
Add to |
3 |
2.5 |
2 |
2 |
1.5 |
1 |
1 |
1 |
0.5 |
0.5 |
0 |
If the difference between two sources is 10dB or more, then the SPL remains that of the higher.
How Is Noise Perceived?
Now that we have explored the measurement of pressure waves moving outward from a source we can look at how that sound is perceived. The human ear is not an accurate instrument for measuring sound levels, as the perception of sound loudness varies with frequency (pitch) and loudness.
Frequency
The frequency of a sound is expressed in Hertz (Hz). 1 Hz equals 1 cycle, or 1 vibration per second. The perceived loudness of a sound to the human ear varies depending on the frequency of that sound. The ear is more sensitive to sounds in the middle of the audible spectrum, with maximum sensitivity between 700 and 5,000 Hz. In other words, the human ear is less sensitive to lower-frequency (low-pitch) and to higher-frequency (high-pitch) sounds.
Loudness
Back in the 1930s, researchers Fletcher and Munson did experiments on this relationship and developed the first series of curves that closely approximate the response of the human ear to both frequency and loudness. These curves have since been revised and are now commonly known as the Normal Equal-Loudness Level Contours.
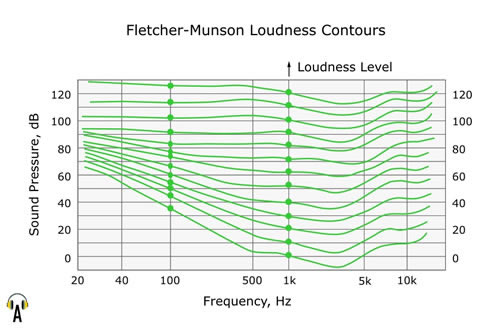
These curves represent a plot of sound pressure levels of pure sine tones that are generally perceived as being equally loud.
As an example, take a look at the sixth curve from the top. It shows that if a 1kHz sine tone is played at 70dB, a 70Hz tone would have to be played at nearly 80dB to be perceived as equally loud; and a 16kHz tone would have to be played at 90dB to be perceived as equally loud and so forth.
These curves show that a lower-frequency tone has to be played louder in order to be perceived as the same loudness as a mid-frequency tone. Similarly, a high frequency tone has to be played louder than a mid-frequency tone for it to be perceived as the same loudness.
These curves also show that as the loudness of a sound increases, the effect of the bias of the human ear in the perception of loudness with changing frequency is somewhat reduced (the louder top curves are flatter across the frequency spectrum than the lower quieter curves).
Sound Weighting Systems
A decibel weighting system has been developed to compensate for the biased response of the human ear. Nearly all sound level meters incorporate electronic filters that reflect standardised decibel weighting systems, of which the three most widely used are; A-weighting, B-weighting and C-weighting. A-weighting, designated as dB(A), is the most commonly used international standard to rate noise, as it closely correlates to the human subjective response.
Frequency and loudness are not the whole story. There are several other factors that affect how we perceive sound, all of which complicate to some degree any attempts to express sound levels accurately in terms of decibels. Other factors include waveform, complexity, spectrum, harmonic content, duration, spatial properties, attack and decay characteristics of the sound and the simultaneous presence of other sounds.
For example the sound from a PC or from a PC component cannot be judged as a "noise" purely from measuring the frequency and loudness, even weighted loudness designated as dB(A). It is other properties of the sound, such as the harmonics, duration, and timing that influence our subjective response to the sound and whether it is deemed unwanted or unpleasant. This study of how humans perceive, react to and interact with music, noise and sound is called psychoacoustics.
Sound Power Levels vs Sound Pressure Levels
In order to understand the application of sound measurement in the IT industry, it is important to distinguish between Sound Pressure Levels (defined above) and Sound Power Levels. Sound power level (SWL) is the measure of the total energy of the source. It is independent of the environment. Here are two examples to illustrate the difference between sound pressure and sound power.
Imagine a person sitting in front of a fire. The acoustic power can be likened to the total amount of heat generated by the fire and the acoustic pressure can be likened to the temperature felt by the person.
Alternatively, think of sound power as the wattage rating of a light bulb. Sound pressure corresponds to the brightness in a particular part of the room. Both can be measured with a meter and the immediate surroundings influence the magnitude of each. In the case of light, brightness is more than a case of bulb wattage. How far is the bulb from the observer? What colour is the room and how reflective is the wall surface? Is the bulb covered with a shade? All of these factors affect how much light reaches the receiver.
In the same way, sound pressure depends not only on the sound power emitted by the source but also on its surroundings. For example, the measurement of sound pressure of a noisy piece of office equipment depends on the acoustics of the office, such as the curtains, carpet, surface texture and angularity. All of these environmental influences affect how much sound reaches the receiver.
Noise Measurement for IT Equipment
Noise figures given for a particular piece of IT equipment are dependent upon how they have been measured. Distance, background noise and room conditions are all important factors that may affect measured noise figures.
It is, therefore, important to know which of the many noise measurement standards have been used to obtain the figures quoted by manufacturers. It is meaningless to be told that a piece of equipment has a noise emission of 20dB(A) without also being told how that 20dB(A) value was measured!
We also need to be told whether it is the sound pressure level or the sound power level that is being quoted. The difference between these is significant and can be up to 12 decibels. Sound power levels (often given the symbol LWA), are always higher than sound pressure levels (LpA), making product figures look a lot more favourable if sound pressure levels are quoted rather than sound power levels. This is why manufacturers often quote sound pressure level figures!
For example, sound pressure levels for a PC component such as a DVD Writer or Hard Disk Drive, can be obtained quite cheaply by using a sound pressure level meter. However, it is considerably more expensive to have a product measured and certified according to international standard for sound power levels in a qualified acoustic laboratory.
Declaration of Sound Power Levels
The world's two most important standards for IT noise declarations are ISO 9296 and ECMA-109, on which ISO 9296 is based. At present, we are not lacking standards on how to measure and declare IT noise emissions but we are lacking widespread adoption. The International Organization for Standardization (ISO) is a network of national standards institutes from 140 countries working in partnership with international organizations, governments, industry, business and consumer representatives. The European Computer Manufacturers Association (ECMA) is a Europe-based organization for standardizing information and communication systems.
In these standards it is stated:
- ISO 9296: 'For the presentation of declared noise emission values, it is of prime importance to declare sound power levels, LWA. It is recognised, however, that users still desire information on sound pressure levels, LpA. Therefore this standard specifies that both quantities shall be declared.'
- ECMA-109: on which ISO 9296 is based: 'For the presentation of declared noise emission values, it is of prime importance to declare A-weighted sound power levels, LWA. It is recognised, however, that users still desire information on A-weighted sound pressure levels LpA. Therefore, ECMA-109 specifies that both quantities shall be declared. In the preparation of this ECMA standard divergences of opinion have been found between various national and international organisations as to the most useful way of presenting noise emission values. In order to avoid any misunderstanding between presentation of sound power levels in decibels re. 1 pW and sound pressure levels in decibels re. 20 mPa, this ECMA Standard expresses sound power level emission values in bels and sound pressure level emission values in decibels, to alleviate the divergences of opinion mentioned.'
It appears that users still desire sound pressure level figures even though sound power level values are not only more useful for product comparisons and purchase decisions, but can also be used to calculate the sound pressure level values.
Noise Measurement Standards
Noise measurement standards are used to collect emission data, while the declaration standards can be seen as the interface where manufacturers and purchasers/users meet.
The ISO Measurement Standards are:
ISO 7779: 'Acoustics - Measurement of airborne noise
emitted by computers and business equipment.'
This is the internationally accepted standard for measuring noise emissions
from personal computer system units, hard disks and other storage media. It
specifies operating and installation conditions in an acoustical laboratory
in order to have reproducible and repeatable values.
ISO 9295: 'Acoustics - Measurement of high-frequency
noise emitted by computers and business equipment.'
This is used as a complement to ISO 7779 for measuring high-frequency noise
(in the 16 kHz octave band).
ISO 10302: 'Acoustics - Method for the measurement of
noise emitted by small air-moving devices.'
This is the internationally accepted standard for noise measurement of fans.
The ISO Declared Standard is:
ISO 9296: 'Acoustics - Declared noise emission values
of computers and business equipment.'
This is the internationally accepted standard for declaration of acoustic
noise emissions from IT equipment. It specifies reporting statistical maximum
values of the A-weighted sound power levels in decibels (LWAd).
This is the 'declared A-weighted sound power level'. The word 'declared',
here stated by a small letter d, is very important. It means that the standard
mathematically corrects for uncertainty in both measurement and production.
Some manufacturers have disliked the correction for uncertainty because ISO
9296 values become about 0.3 - 0.4 B above the sound power level (LWA).
The measurements have to be taken according to ISO 7779.
ISO 9296 is the only standard that has to be declared when labelling IT noise emissions.
What to Look For
To show that IT noise figures have been obtained and declared according to ISO standards the following information needs to be given.
Product: (The name of the product)
Declared noise emissions in accordance with ISO 9296
Operating |
Idling |
Sleep |
|
LWad |
x.xB |
x.xB |
x.xB |
LpAm |
xxdB |
xxdB |
xxdB |
In this complete noise declaration, sound pressure level figures are also included. LpAm shows that the manufacturer is declaring the operator's or bystander's position. The lowest possible values of x are what is desirable if searching for a quiet product.
How Noise from PCs Affects our Health
Tomas Risberg, a Stockholm physician who operates the Silent PC website, http://silent.se/pc has explored how noise from PCs and from other IT equipment can affect our health. He states that high intensity noise emissions can be dangerous to us but even low intensity noise can adversely affect our well-being, degrade speech intelligibility and may adversely affect our work performance. Audible sound consciously or unconsciously calls for and competes for our attention.
Continuous, monotonous sound can decrease our alertness. Alertness is a basic requisite for full attention. Attention is what is needed in information collection and processing and is an important component of human brain function.
Silence is important because it provides a neutral background against which sounds of interest can be heard. It also frees brain energy for different types of processing other than acoustic information.
The human brain can only process a limited amount of information at any one time. If we want to use our brain as constructively as possible, we need to provide an environment with only the most valuable information available.
Background IT equipment noise can be regarded as acoustic information but information that we do not need. We do not usually need to be continuously informed that a piece of IT equipment is on. Our brains can function more productively if this unwanted acoustic information is not present.
The World Health Organization recommends an ambient noise floor (background noise level) of 35dB(A) for easily understandable speech and to avoid irritation with background noise.
References and Helpful Links
References
Hewlett Packard - HP PCs and Acoustic Noise. Copyright Hewlett Packard Company 1997 04/97 rev.1
Clay's Handbook of Environmental Health 18th Edition (1999). Spon Press. Edited by WH Bassett. ISBN: 0419229604
Master Handbook of Acoustics, 4th Edition. McGraw Hill (2001). F Alton Everest. ISBN: 0-07-136097-2
Helpful Links
Article: 'Peace, Quiet & Power, Too - Silence Your PC' - from Smart Computing In Plain English
Website: The Silent PC™ - investigates the acoustic aspect of information technology (IT) ergonomics.
Article: 'A guide to decibels and how to use them' - by Ian Drumm, from Salford Acoustics Audio and Video
Article: 'Noise in Computing' - from Silent PC Review
Article: 'All About Decibels, Part I: What’s your dB IQ?' - by Lionel Dumond, ProRec.com
Article: 'Part II: What’s your dB IQ?' - by Lionel Dumond, ProRec.com
Article: 'Disc Drive Acoustics' - from Seagate.com
![]() Home | About | Solutions | News | Sitemap | Terms | Privacy | Contact
Home | About | Solutions | News | Sitemap | Terms | Privacy | Contact
Acousti Products is a division of The Rack People™, a company registered in England & Wales
No. 04514007. Registered Office: Lifford Hall, Lifford Lane, Kings
Norton, Birmingham, B30 3JN UK (previously named Acousti Products Ltd
- change of name May 2013).
All Rights Reserved. Graphics and
content ©2013 The Rack People™